Causes of major page faults


There’s a common Prometheus alert called “NodeMemoryMajorPagesFaults”. It’s part of the Node Exporter’s node-mixin project and also included in the kube-prometheus-stack default alert rules.
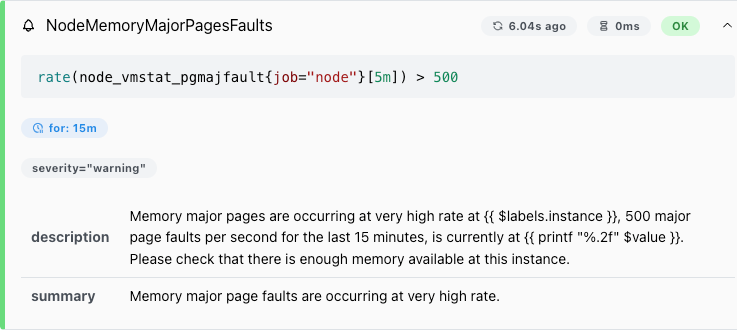
But what does this alert mean, and what do you do about it? This article helps you form a good mental model and provides practical guidance.
What are major page faults anyway?
“Major page fault” means that an application is using the memory management system to either read data from disk, or to swap in memory.
- Despite the ominous name, it doesn’t mean that the system is encountering errors. However, since it indicates heavy disk reads, it could still indicate that something is wrong.
- The part “using the memory management system” is key: major page faults are a separate I/O pathway from the normal one.
- The part about “reading data” is also important: major page faults are strictly about reading data.
A NodeMemoryMajorPageFaults alert should thus be interpreted as “there is heavy disk read activity, either reading from file or from swap”.
Virtual memory
To understand why major page faults are called this way and what they actually do, we have to first understand virtual memory.
When an application uses memory, one might think that the application uses a part of your physical RAM.

But on modern operating systems, applications do not access the physical RAM directly. Instead, they access a virtual representation of RAM — virtual memory. This virtual memory is “infinite” in size (256 TB on x86_64), and is also called the address space.
Virtual memory is organized in chunks called “pages”. A page might be backed by a piece of the physical RAM, but also pieces of other things, like a swap disk or a file. Obviously your real RAM is not as big as the address space. The fact that a page can be swapped to disk is one of the reasons that a large address space is possible.

Having parts of virtual memory be backed by a file is also called “memory mapping”, or “mmap” in short.
When an application reads from a page that’s not backed by RAM, the CPU complains and raises a “major page fault” event. This triggers the operating system kernel, which then fetches the data from swap or a file.
“Minor page faults” exist too, but that’s out of the scope of this article.
This fetching isn’t done on every access: such data is cached in RAM. The kernel calls this storage location the “page cache”. This cache can be evicted when the system is low on RAM.
Who is producing major page faults?
The Prometheus alert doesn’t tell you which process caused major page faults. How can you find out?
Through some preliminary Internet searches I’ve found that /proc/$PID/stat has a “majflt” field that shows the number of major page faults produced so far by this process. So we could write a shell script that parses /proc/*/stat, waits for a period of time, then parses those files again, and compares the results to find the offending process. But this is rather cumbersome.
Major page faults involve I/O, so maybe they’d show up in iotop. However, since they use a special I/O pathway, it’s unclear whether they’d actually appear in iotop. We have to verify this.
And finally, even if we’ve managed to identify the offending process, how can we find the offending file? Or if it’s caused by swapping, how can we see that?
Before continuing the research, we need a way to reproduce major page faults.
Reproducing file-backed major page faults
We write a C program which:
- Maps a file into memory.
- In an infinite loop:
- Sequentially read all parts the file-backed memory address, on a page-by-page basis.
- Tell the kernel that it’s free to evict the page cache for this file.
Step 2.2 is important. Reading the file-backed memory addresses will result in all that data being cached in RAM. Once cached, reading from those addresses will no longer produce major page faults.
Telling the kernel to evict the page cache requires two actions:
- The application must mark the memory address as “unused”. This is done with the madvise(MADV_DONTNEED) call. However, this is only a hint, and during testing I’ve found that the Linux kernel does not actually evict the page cache. That’s where action 2 comes in.
- Tell the kernel to evict its page cache by running
echo 1 > /proc/sys/vm/drop_caches. Note that this only works ifmadvise(MADV_DONTNEED)was called.
Source code of the C program:
// Save as filemajorpagefaults.c
#include <stdio.h>
#include <stdlib.h>
#include <sys/mman.h>
#include <sys/stat.h>
#include <fcntl.h>
#include <unistd.h>

int main(int argc, char *argv[]) {
    if (argc < 2) {
        fprintf(stderr, "Usage: %s <file-to-map>\n", argv[0]);
        exit(EXIT_FAILURE);
    }

    // Open a file in read-only mode.
    int fd = open(argv[1], O_RDONLY);
    if (fd < 0) {
        perror("open");
        exit(EXIT_FAILURE);
    }

    // Obtain the file size.
    struct stat st;
    if (fstat(fd, &st) == -1) {
        perror("fstat");
        close(fd);
        exit(EXIT_FAILURE);
    }
    size_t filesize = st.st_size;
    if (filesize == 0) {
        fprintf(stderr, "Error: File size is zero.\n");
        close(fd);
        exit(EXIT_FAILURE);
    }

    // Memory–map the file.
    char *map = mmap(NULL, filesize, PROT_READ, MAP_SHARED, fd, 0);
    if (map == MAP_FAILED) {
        perror("mmap");
        close(fd);
        exit(EXIT_FAILURE);
    }

    int pagesize = getpagesize();

    // Infinite loop: drop pages and then access the mapping to force a major fault.
    while (1) {
        // Access the mapping. This read will trigger a page fault
        // if the page is not in cache.
        for (size_t i = 0; i < filesize; i += pagesize) {
            volatile char value = map[i];
            (void)value; // Use the value to avoid compiler optimizations.
        }

        // Advise the OS that the pages are no longer needed.
        if (madvise(map, filesize, MADV_DONTNEED) != 0) {
            perror("madvise");
            exit(EXIT_FAILURE);
        }
    }

    return 0;
}
We create a large file (let’s say 512 MB), then we compile and run the program:
dd if=/dev/zero of=block bs=1M count=512
cc -Wall filemajorpagefaults.c -o filemajorpagefaults
./filemajorpagefaults block
In another terminal, we continuously tell the kernel to evict the page cache:
while true; do echo 1 > /proc/sys/vm/drop_caches; done
Now that the simulation and the page cache eviction loop are running, let’s verify that the program actually generates major page faults. According to the /proc/$PID/stat man page, majflt is field number 12, so:
cat /proc/$(pidof filemajorpagefaults)/stat | awk '{ print $12 }'
# => prints: 53
sleep 60
cat /proc/$(pidof filemajorpagefaults)/stat | awk '{ print $12 }'
# => prints: 450
The counter goes up. Success: we’ve reproduced file-backed major page faults!
Reproducing swap-backed major page faults
We write a C program that:
- Allocates more memory than we have RAM.
- In an infinite loop, sequentially read every page in the allocated memory range.
Because not all parts of the allocated memory fit in RAM, this should result in constant swapping.
Source code:
// Save as swapmajorpagefaults.c
#include <stdio.h>
#include <stdlib.h>
#include <string.h>
#include <unistd.h>

int main(int argc, char *argv[]) {
    if (argc < 2) {
        fprintf(stderr, "Usage: %s <size in MB>\n", argv[0]);
        return EXIT_FAILURE;
    }

    // Convert the command-line argument to a long integer.
    long mb = atol(argv[1]);
    if (mb <= 0) {
        fprintf(stderr, "Invalid size provided: %s\n", argv[1]);
        return EXIT_FAILURE;
    }

    // Calculate total size in bytes.
    size_t totalsize = mb * 1024 * 1024;

    // Allocate the memory.
    char *buffer = malloc(totalsize);
    if (buffer == NULL) {
        fprintf(stderr, "Memory allocation failed\n");
        return EXIT_FAILURE;
    }

    // Initialize the memory: force the kernel to actually allocate it.
    memset(buffer, 0, totalsize);

    // Get the system's page size.
    int pagesize = getpagesize();

    // Infinite loop: sequentially read a byte from every page.
    while (1) {
        for (size_t offset = 0; offset < totalsize; offset += pagesize) {
            // The volatile keyword forces the compiler to actually perform the read.
            volatile char value = buffer[offset];
            // Optionally, do something with 'value' to prevent further optimization.
            (void)value;
        }
    }

    return 0;
}
Before running the program, let’s check the system’s memory usage:
$ free -m
               total        used        free      shared  buff/cache   available
Mem:            7751        1075        5661          15        1303        6675
Swap:              0           0           0
The system has 7551 MB RAM, no swap. We create a 1.5 GB swap file and enable it:
dd if=/dev/zero of=block bs=1M count=1536
chmod 600 block
mkswap block
sudo swapon block
We then compile and run the program:
cc -Wall swapmajorpagefaults.c -o swapmajorpagefaults
./swapmajorpagefaults 7751
After some time, we confirm that the system is swapping:
$ free -m
               total        used        free      shared  buff/cache   available
Mem:            7751        7648         163           0         151         102
Swap:           1535        1140         395
We also confirm that the program generates major page faults:
cat /proc/$(pidof swapmajorpagefaults)/stat | awk '{ print $12 }'
# => prints: 803
sleep 5
cat /proc/$(pidof swapmajorpagefaults)/stat | awk '{ print $12 }'
# => prints: 18838
Does iotop show major page faults?
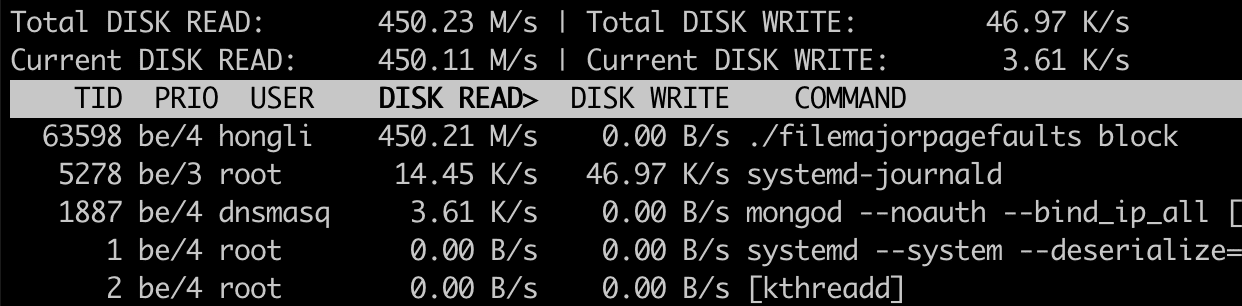
When filemajorpagefaults and the associated page cache eviction loop are running, we see that there’s a lot of disk read activity. So, yes, iotop does show file-backed major page faults.
One thing of note: by default, iotop sorts processes by disk write, so it doesn’t show the majorpagefaults simulator on top. To see it, I had to press the left arrow key to sort by disk read.
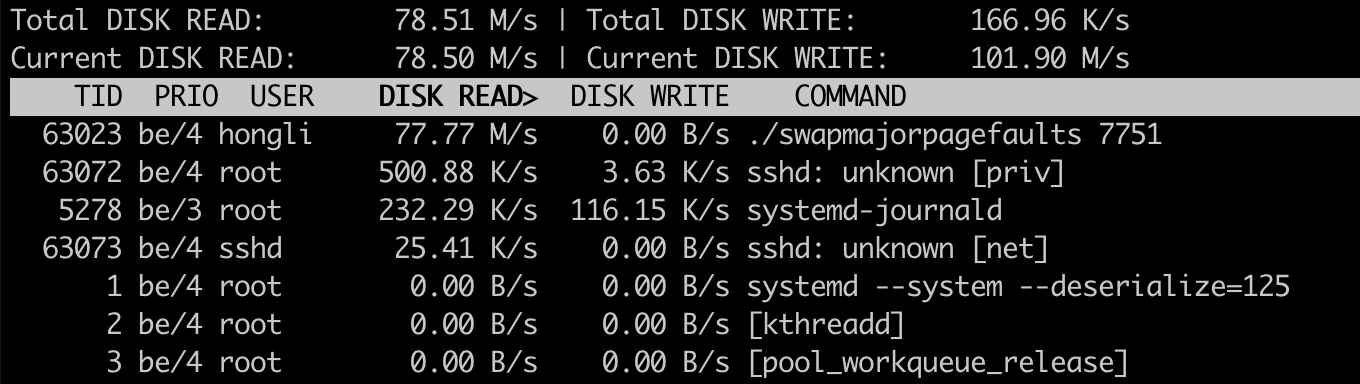
When swapmajorpagefaults is running, we also see that there’s a lot of disk read activity. So, yes, iotop also shows swap-backed major page faults.
Identifying exact major page fault source
Since iotop allows us to identify the offending process, how do we know whether it’s caused by file access or by swapping? And if it’s caused by file access, how do we know which file? Here’s a possible methodology:
- Find out the virtual memory address at which the major page fault occurred.
- Look in /proc/$PID/maps to see whether that address maps to a file. If not, then it’s swap.
For finding out the major page fault memory address, here are some methods:
- Using the perf whole-system profiler.
- Using eBPF tracing (bpftrace).
Both tools make use of kernel tracing events under the hood. perf is more limited in its user interface and supports fewer kinds of tracing events, but that also makes it relatively easy to use. bpftrace is more flexible and complicated, allowing you to write arbitrary tracing logic.
They also differ in where they perform the tracing. perf performs most of its logic outside the kernel (in userspace), while bpftrace uploads an eBPF program to the kernel and runs it there. The latter is what allows bpftrace to be more flexible.
Some of my production systems run on AWS BottleRocket. Its kernel is very locked down, so it doesn’t have a convenient tracing event that perf can use. Instead, I have to use more cumbersome events that require more logic to extract the data that I want. That is only possible using bpftrace. So I will cover using both tools.
Inspecting file-backed major page faults with perf
We start by installing Perf:
# Debian/Ubuntu:
sudo apt install linux-tools-common linux-tools-generic
We run perf list to see what kind of tracing events we can use:
$ perf list
List of pre-defined events (to be used in -e or -M):

  ...
  major-faults                                       [Software event]
  ...
  page-faults OR faults                              [Software event]
  ...
  exceptions:page_fault_user                         [Tracepoint event]
There are several candidates which seem useful. Let’s try “page-faults” first. We run filemajorpagefaults and the associated page cache eviction loop, then we run perf record to start recording events:
sudo perf record -e page-faults -p $(pidof filemajorpagefaults)
After a few seconds, we press Ctrl-C to stop the recording. We then inspect the recorded events with perf script:
$ sudo perf script
 filemajorpagefa   52415 237518.889179:    1 page-faults:   6535fd11440a main+0x1c1 (/home/hongli/filemajorpagefaults)
 filemajorpagefa   52415 237519.122898:    1 page-faults:   6535fd11440a main+0x1c1 (/home/hongli/filemajorpagefaults)
In the output we see a bunch of things:
- The program name (“filemajorpagefa”, truncated)
- The PID (52415)
- A timestamp (237518.889179)
- The event name (page-faults)
- A virtual memory address (0x6535fd11440a)
Now, let’s check /proc/$PID/maps. Here’s a snippet:
6535fd114000-6535fd115000 r-xp 00001000 08:01 256489  /home/hongli/filemajorpagefaults
...
71f48d800000-71f4ad800000 r--s 00000000 08:01 257163  /home/hongli/block
71f4ad800000-71f4ad828000 r--p 00000000 08:01 150182  /usr/lib/x86_64-linux-gnu/libc.so.6

^-- start    ^-- end      ^-- permissions             ^-- filename (optional)
    addr         addr
- Column 1 (6535fd114000-6535fd115000) is an address range.
- Column 2 (r-xp) is the permissions on that address range, e.g., whether it’s read-write or read-only.
- Column 6 (/home/hongli/filemajorpagefaults) whether this range maps to a file.
We expected the memory address reported by perf (0x6535fd11440a) to map to /home/hongli/block, but we see that it actually maps to /home/hongli/filemajorpagefaults! Furthermore, this address range is executable (“x”), which means that it contains code. So 0x6535fd11440a is not the address at which the page fault occurred, but the address at which the CPU was executing instructions (instruction pointer)!
Upon inspecting the perf record and perf script man pages and performing additional Internet searches, it seems that the page-faults event is incapable of recording the memory access address.
Running the test again with the major-faults event yields the same result.
Might we fare better with exceptions:page_fault_user?
$ sudo perf record -e exceptions:page_fault_user -p $(pidof filemajorpagefaults)
<pressed Ctrl-C after a few seconds>
[ perf record: Woken up 1 times to write data ]
[ perf record: Captured and wrote 0.010 MB perf.data (32 samples) ]

$ sudo perf script
 filemajorpagefa   52415 [002] 238352.611105: exceptions:page_fault_user: address=0x71f4acc00000 ip=0x6535fd11440a error_code=0x4
...
Success: there’s now an address field in addition to an ip (instruction pointer) field! Looking in /proc/$PID/maps, 0x71f4acc00000 indeed belongs to the range mapped to /home/hongli/block!
Inspecting swap-backed major page faults with perf
Let’s see how things look like when major page faults are caused by swapping. With swapmajorpagefaults running, we start recording page faults:
$ sudo perf record -e exceptions:page_fault_user -p $(pidof swapmajorpagefaults)
<pressed Ctrl-C after a few seconds>
[ perf record: Woken up 7 times to write data ]
[ perf record: Captured and wrote 2.048 MB perf.data (24276 samples) ]

$ sudo perf script
 swapmajorpagefa   66634 [002] 293739.435811: exceptions:page_fault_user: address=0x7303e3871000 ip=0x7305213993ba error_code=0x6
Let’s look for 0x7303e3871000 in /proc/66634/maps:
73033ca00000-730521101000 rw-p 00000000 00:00 0

^-- start    ^-- end      ^-- permissions             ^-- filename (optional)
    addr         addr
This address range has no filename. This means that it belongs to “normal” memory and is not backed by a file. Any major page faults occurring here is due to swapping.
Inspecting major page faults with bpftrace
Recall the reason I’m showing how to use bpftrace: on BottleRocket I can’t use the exceptions:page_fault_user event. There are other events, but they can only be used by bpftrace.
What events can we use? One candidate I was able to find, is kprobe:handle_mm_fault. This corresponds to the handle_mm_fault function in the Linux kernel. According to Understanding the Linux Virtual Memory Manager by Mel Gorman, handle_mm_fault is the function where page fault handling starts (chapter 4.6.1 Handling a Page Fault). This function is architecture-independent (calls architecture-specific parts internally) and its functionality and function signature are relatively stable over time.
According to the code, there is an address parameter that identifies the page fault address. But we also want to distinguish between major and minor page faults. This distinction is not passed to handle_mm_fault. Instead, its return value tells us whether the page fault was a major one. From the book:
The possible return values for handle_mm_fault() are VM_FAULT_MINOR, VM_FAULT_MAJOR, VM_FAULT_SIGBUS and VM_FAULT_OOM.
In bpftrace we don’t have access to constants (which only exist during C compile time). So we have to look for the integer value for VM_FAULT_MAJOR. After a search, we find its definition in the C header mm_types.h:
enum vm_fault_reason {
    ...
    VM_FAULT_MAJOR = (__force vm_fault_t)0x000004,
    ...
};
So the value is 4.
With this knowledge, we can start designing a bpftrace script. We want to:
- Attach to the
kprobe:handle_mm_faultevent and extract theaddressargument. - Attach to the
kretprobe:handle_mm_faultevent (which is fired when the function returns) and check whether the returned bitmask containsVM_FAULT_MAJOR. If so, then log the address.
Source:
// Save as handle_mm_fault.bpftrace

// Change 581572 to the page fault simulator's actual PID.
kprobe:handle_mm_fault /pid == 581572/
{
    // Save the faulting address (arg1, or 2nd parameter) to a map, keyed by thread ID.
    // We'll use it later when handle_mm_fault returns (in the kretprobe).
    @fault[tid] = arg1;
}

// 4 is the value for VM_FAULT_MAJOR.
kretprobe:handle_mm_fault /(@fault[tid] && (retval & 4))/
{
    // If the return value has VM_FAULT_MAJOR set, print the faulting address.
    printf("major page fault at 0x%lx\n", @fault[tid]);
    delete(@fault[tid]);
}
Now let’s install bpftrace:
# Debian/Ubuntu
sudo apt install bpftrace

# AWS BottleRocket (in admin container) and Amazon Linux
sudo yum install bpftrace
With a major page fault simulator running (either filemajorpagefaults or swapmajorpagefaults), we run bpftrace:
# bpftrace handle_mm_fault.bpftrace
Attaching 2 probes...
major page fault at 0xffff87b39000
major page fault at 0xffff8e029000
major page fault at 0xffff81859000
...
(press Ctrl-C)
Now that we have a bunch of addresses, let’s search for them in /proc/581572/maps:
ffff6f3d9000-ffff8f3d9000 r--s 00000000 103:10 35875842   /block

^-- start    ^-- end      ^-- permissions                 ^-- filename (optional)
    addr         addr
Success! We’ve verified that the major page fault is related to the file /block!
Or, if the /proc/$PID/maps entry contains no filename or if the filename is “[heap]”, then that means it’s a normal memory range with no file backing. Any major page faults are then caused by swapping.
Conclusion
Major page faults means that there’s heavy disk read activity, either from a file or from swap. We’ve developed a method for investigating the source of major page faults.
First, identify the offending process by looking in iotop and sorting by disk read (pressing the left arrow key).
To determine whether the page faults are due to file access or swapping:
-
Use perf or bpftrace to identify the memory addresses at which page faults.
-
perfis suitable for most systems. To install it:# Debian/Ubuntu: sudo apt install linux-tools-common linux-tools-genericStart tracing on the exceptions:page_fault_user event, and run it for a few seconds:
$ sudo perf record -e exceptions:page_fault_user -p <PID>
<pressed Ctrl-C after a few seconds>
[ perf record: Woken up 7 times to write data ]
[ perf record: Captured and wrote 2.048 MB perf.data (24276 samples) ]

$ sudo perf script
swapmajorpagefa   66634 [002] 293739.435811: exceptions:page_fault_user: address=0x7303e3871000 ip=0x7305213993ba error_code=0x6
The
addres=...column tells you the memory address at which the page fault occurred. -
bpftraceis suitable for AWS BottleRocket. To install it:# Debian/Ubuntu sudo apt install bpftrace # AWS BottleRocket (in admin container) and Amazon Linux sudo yum install bpftraceSave the following bpftrace script. Make sure you change the PID 581572 on line 3 to the actual PID you want to inspect.
// Save as handle_mm_fault.bpftrace

kprobe:handle_mm_fault /pid == 581572/
{
    // Save the faulting address (arg1, or 2nd parameter) keyed by thread ID.
    @fault[tid] = arg1;
}

// 4 is the value for VM_FAULT_MAJOR.
kretprobe:handle_mm_fault /(@fault[tid] && (retval & 4))/
{
    // If the return value has VM_FAULT_MAJOR set, print the faulting address.
    printf("major page fault at 0x%lx\n", @fault[tid]);
    delete(@fault[tid]);
}
Run the trace:
# bpftrace handle_mm_fault.bpftrace
Attaching 2 probes...
major page fault at 0xffff87b39000
major page fault at 0xffff8e029000
major page fault at 0xffff81859000
...
(press Ctrl-C)
-
-
Look up the address in
/proc/$PID/maps. It contains entries in this format:71f48d800000-71f4ad800000 r--s 00000000 08:01 257163 /home/hongli/block ^-- start ^-- end ^-- permissions ^-- filename (optional) addr addr- Column 1 (71f48d800000-71f4ad800000) is the address range in hexadecimal.
- Column 2 (r–s) is the permissions on that address range, e.g., whether it’s read-write or read-only.
- Column 6 (/home/hongli/block) is an optional filename.
If there’s no filename or if the filename is “[heap]”, then it means the major page faults are caused by swapping.